Research
A hybrid approach for future carbon flux estimations.
TROPOMI observations and WRF-CO modelling can be effectively used to tackle Indian air pollution issues
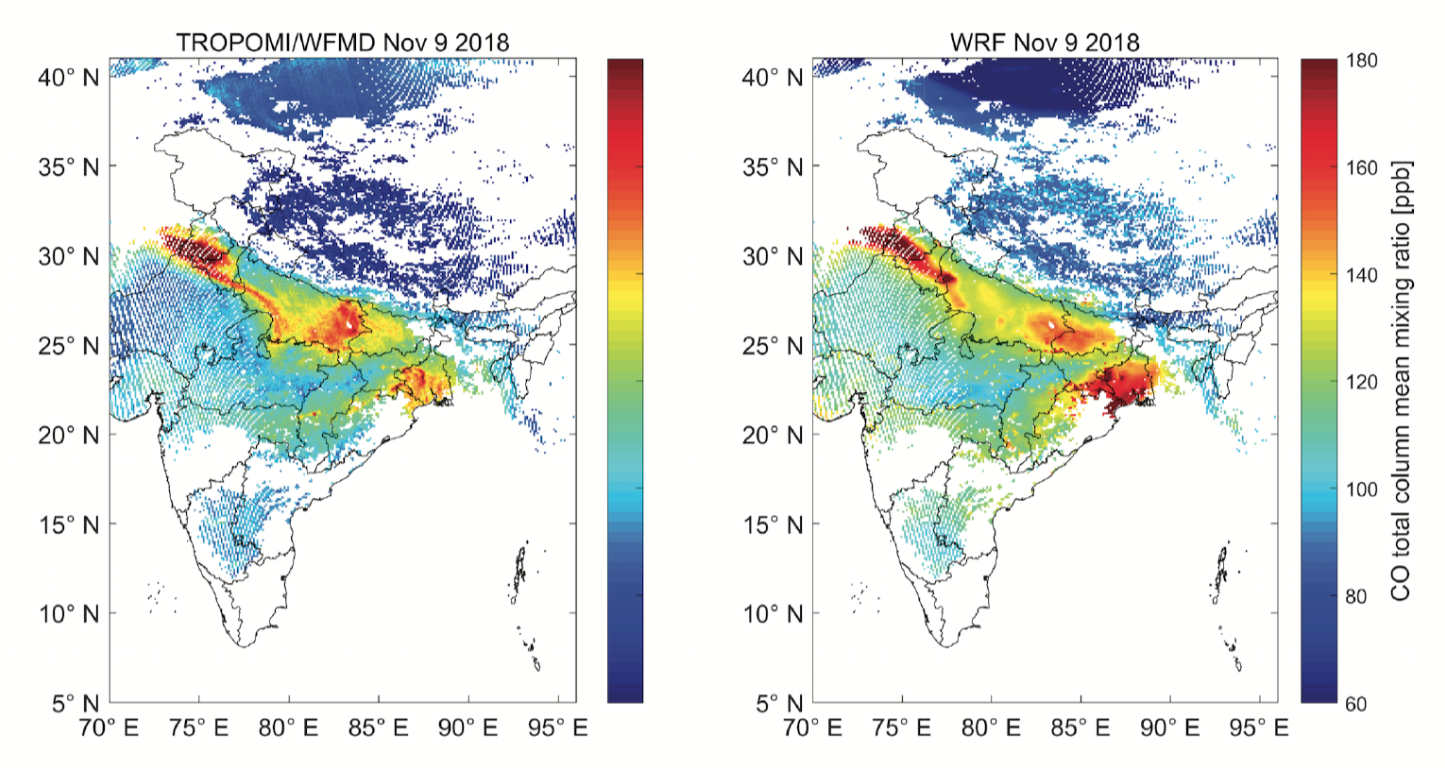
Several ambient air quality records corroborate severe and persistent degradation of air quality over North India during the winter months with evidence of a continued increasing trend of pollution across the Indo-Gangetic Plain (IGP) over the past decade. A combination of atmospheric dynamics and uncertain emissions, including the post-monsoon agricultural stubble burning, make it challenging to resolve the role of each individual factor. Here we demonstrate the potential use of an atmospheric transport model, the Weather Research and Forecasting model coupled with chemistry (WRF-Chem) to identify and quantify the role of transport mechanisms and emissions on the occurrence of the pollution events. The investigation is based on the use of CO observations from TROPOspheric Monitoring Instrument (TROPOMI), onboard the Sentinel 5-Precursor satellite, and the surface measurement network as well as WRF-Chem simulations to investigate the factors contributing to CO enhancement over India during November 2018. We show that the simulated column-averaged dry air mole fraction (XCO) is largely consistent with TROPOMI observations with a spatial correlation coefficient of 0.87. The surface-level CO concentrations show larger sensitivities to boundary layer dynamics, wind speed, and diverging source regions, leading to a complex concentration pattern and reducing the observation-model agreement with a correlation coefficient ranging from 0.41 to 0.60 for measurement locations across the IGP. We find that daily satellite observations can provide a first-order inference of the CO transport pathways during the enhanced burning period, and this transport pattern is reproduced well in the model. By using the observations and employing the model at a comparable resolution, we confirm the significant role of atmospheric dynamics as well as residential, industrial and commercial emissions in the production of the exorbitant level of air pollutants in North India. We find that biomass burning plays only a minimal role in both column and surface enhancements of CO, except for in the state of Punjab during the high pollution episodes. While the model reproduces observations reasonably well, a better understanding of the factors controlling the model uncertainties is essential to relate the observed concentrations to the underlying emissions. Overall, our study emphasizes the importance of undertaking rigorous policy measures, mainly focusing on reducing residential, commercial and industrial emissions in addition to actions already underway in the agricultural sectors. Read more...
Monitoring CO2 source-sink distribution over India via inverse modelling
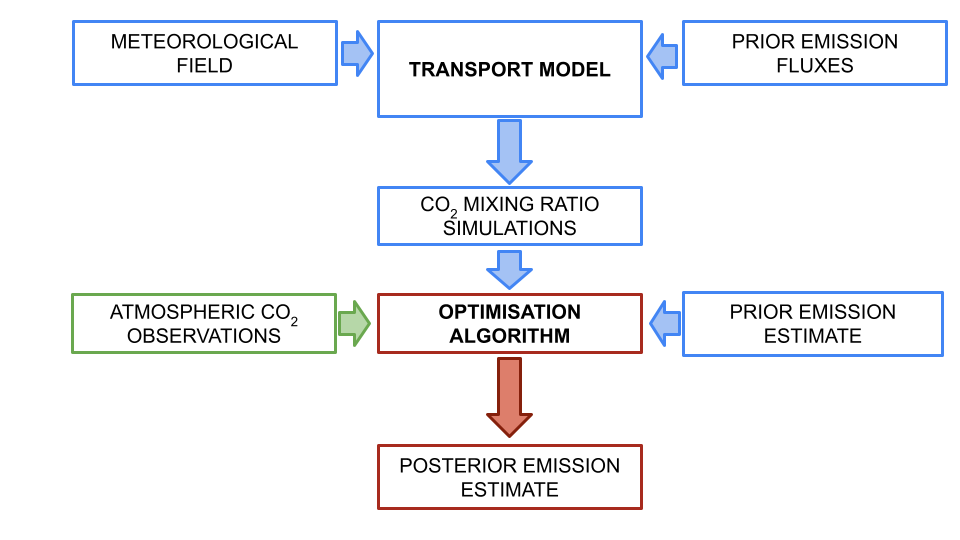
India plans to expand the GHG observation network. For accurate carbon budgeting, we need to critically enhance the inverse modelling capabilities to use these observations. We quantify the impact of unresolved variations in the current models on optimally estimated fluxes via inverse modelling and quantify the associated flux uncertainty. We illustrate how a parameterization scheme captures this variability in the coarse models.
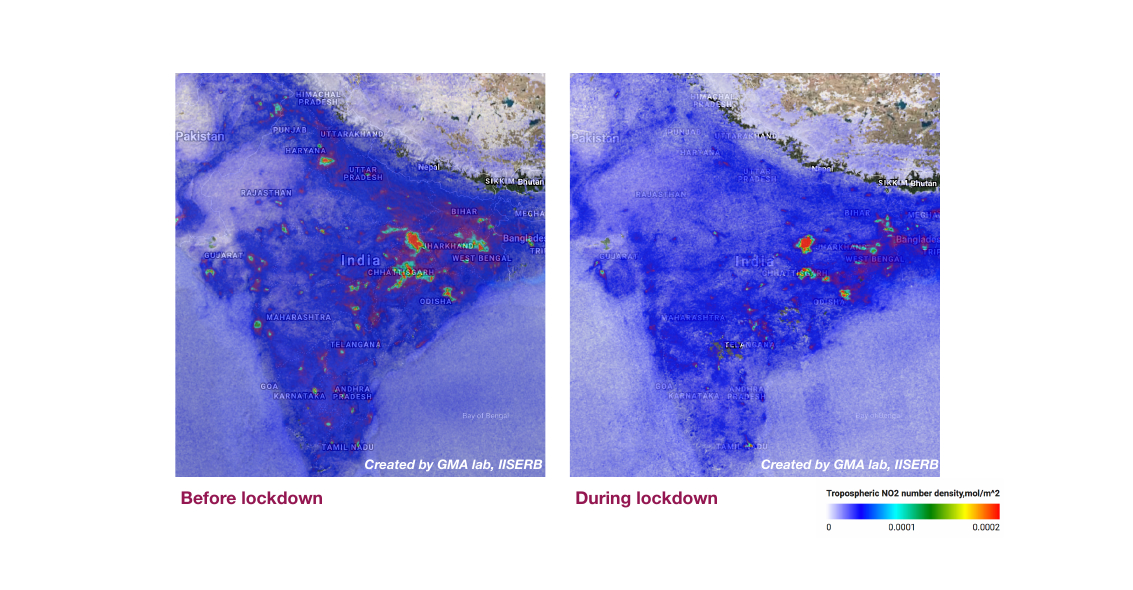
Nitrogen dioxide concentration in the atmosphere before and during COVID-19 restrictions
Satellite retrievals of CH4 concentration (in ppb) over India
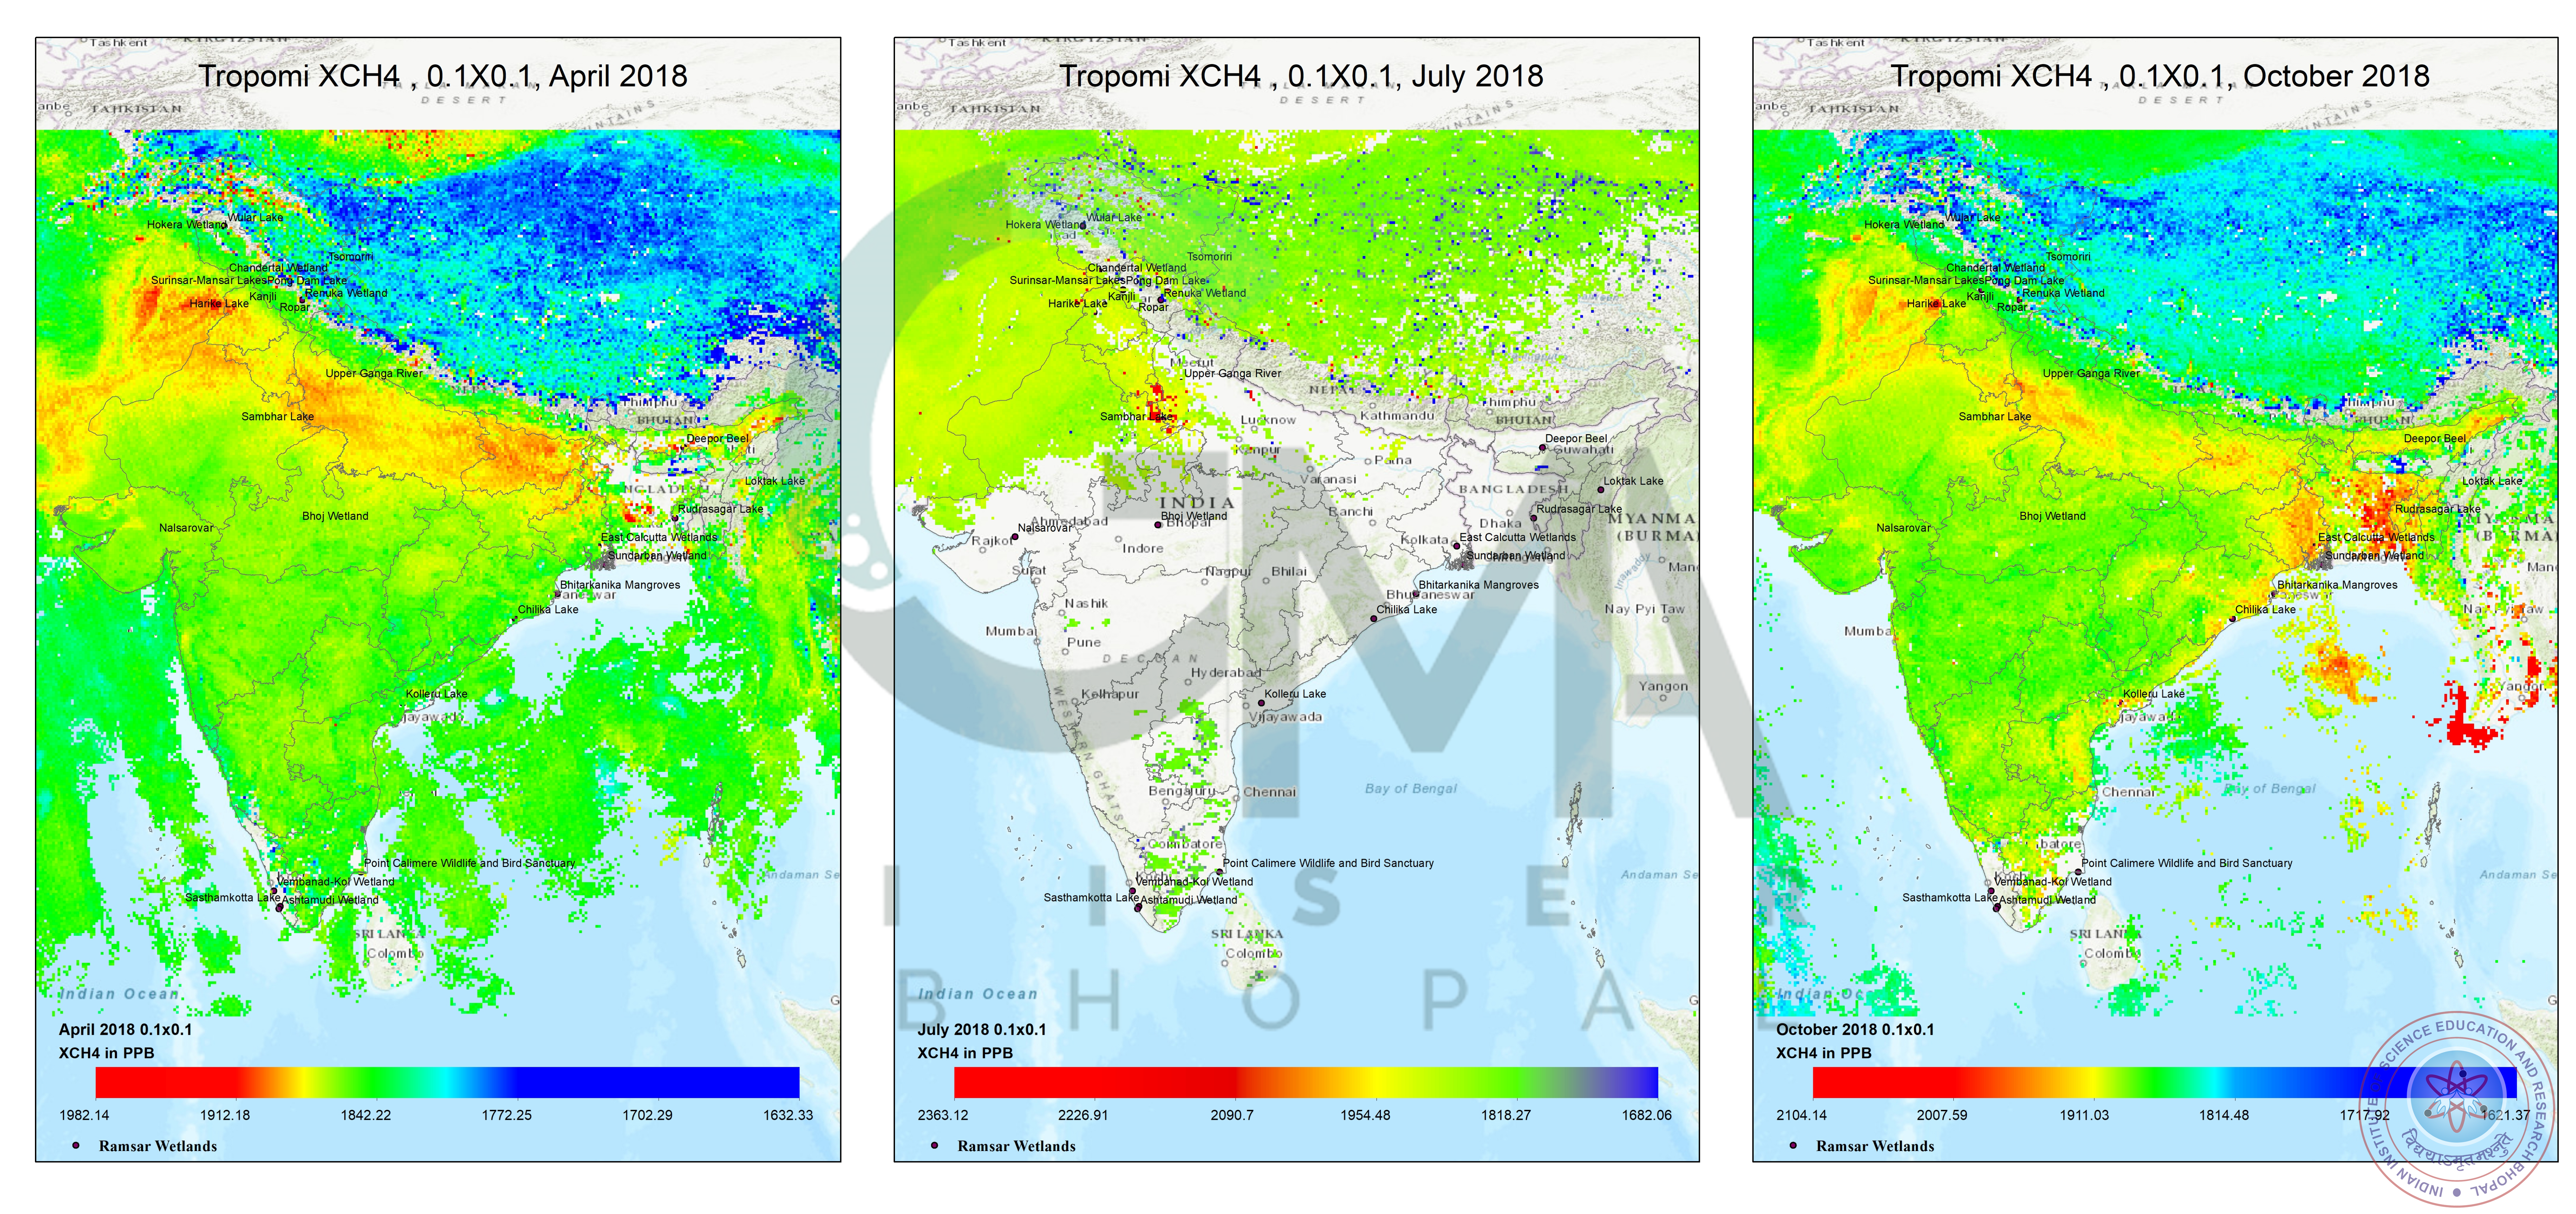
Figure shows the Monthly XCH4 concentration (in ppb) over India for the months of April, July and October. The 0.1o x 0.1o gridded product is generated using Column averaged CH4 observations from Sentinel 5P Satellite. Months of April and October (Pre and Post monsoon) show elevated concentration of methane in Indo-Gangetic plain. Month of July shows the effect of monsoon on satellite observations. Large data gap is seen all over the Indian region due to cloud cover. Credits: Monish V Deshpande
Aircraft observations and modelling simulations of CO2 concentration (in ppm) over India
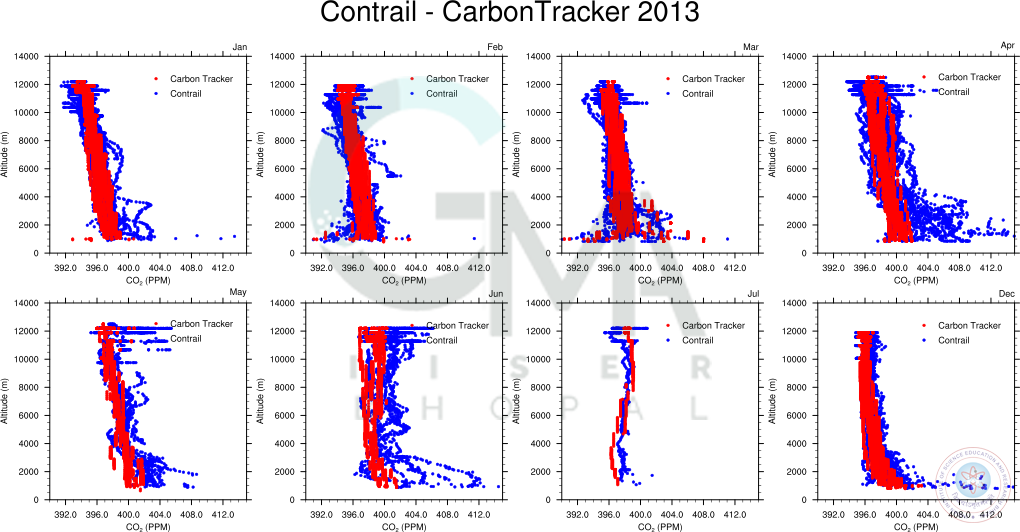
Figure shows the contrast in CO2 concentration of CarbonTracker CT2017 products and CONTRAIL observations over Indian domain during the year 2013. CONTRAIL is an ongoing project that measures atmospheric trace gases using aircraft of Japan Airlines (JAL). Summer months are exhibiting more differences in CO2 concentrations among model and observations. While winter months shows moderate correlation (r2 ~ 0.5) between observation and model, summer months displays null correlation. Differences may be arising from the inability of global climate models to simulate complex atmospheric processes during the summer. Non availability of observations on the Indian domain constrains the proper validation of the models. Credits:Vishnu Thilakan M
In situ observations and modelling simulations of CO2 concentration (in ppm) over India
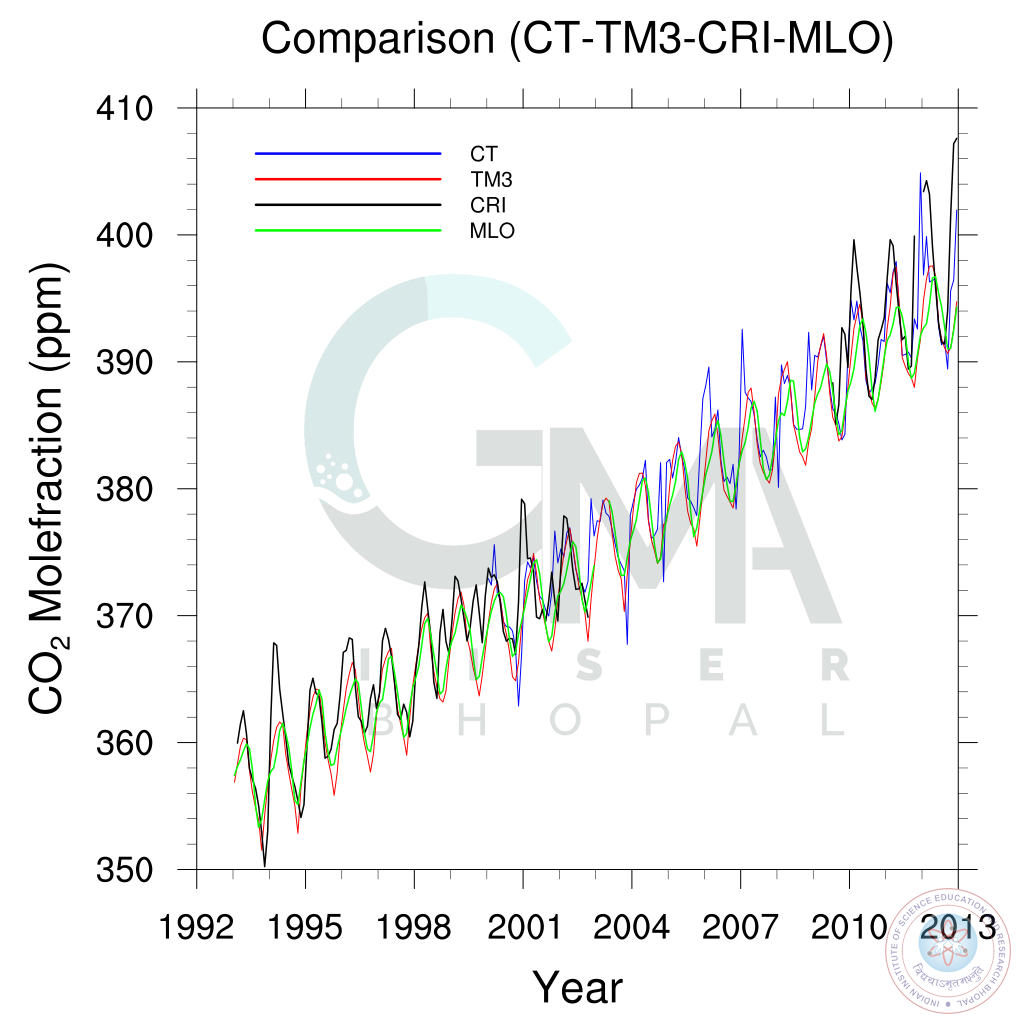
Figure shows the comparison in CO2 molefraction between two models (CarbonTracker(CT) & TM3) with observation from Cape Rama, India (CRI- 15.07oN,73.83oE) and Mauna Loa, United states (MLO- 19.53oN,155.57oW) for Cape Rama region . Even though models are following a pattern almost similar to observation, it is clearly visible that the global models have failed to capture the regional fluctuations in CRI. Compared to TM3, CT is much more close to CRI in showing CO2 variability. Since MLO observation data is used as one of the input for TM3 simulations, TM3 is closely following MLO pattern. Credits: Aparnna Ravi P
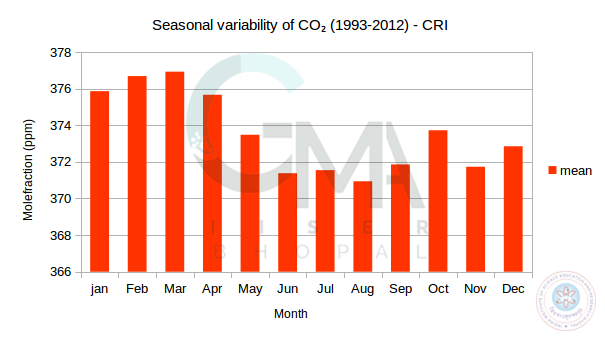
Cape Rama(CRI) was a point observation site in India with observational data availability from 1993-2012 . Over, the 10 year monthly average data over CRI, a seasonal pattern in CO2 mole fraction is observed, with increase in concentration during pre monsoon (MAM) and post monsoon (JFM) months and noticeable decrease in concentration during the monsoon months (JJAS). Credits: Aparnna Ravi P
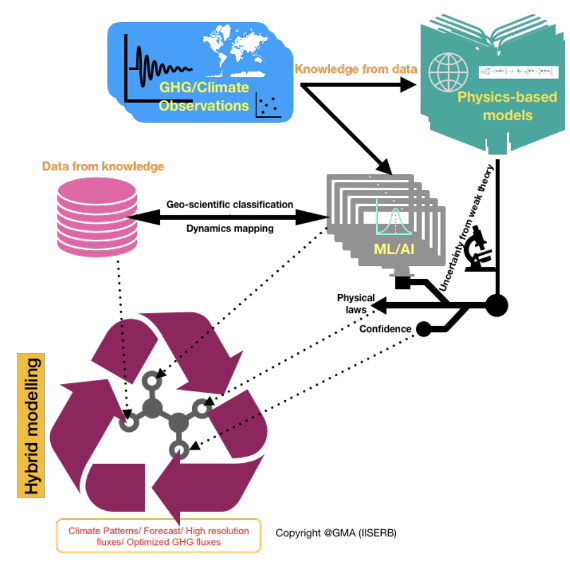
Overview of on-going modelling work @IISERB
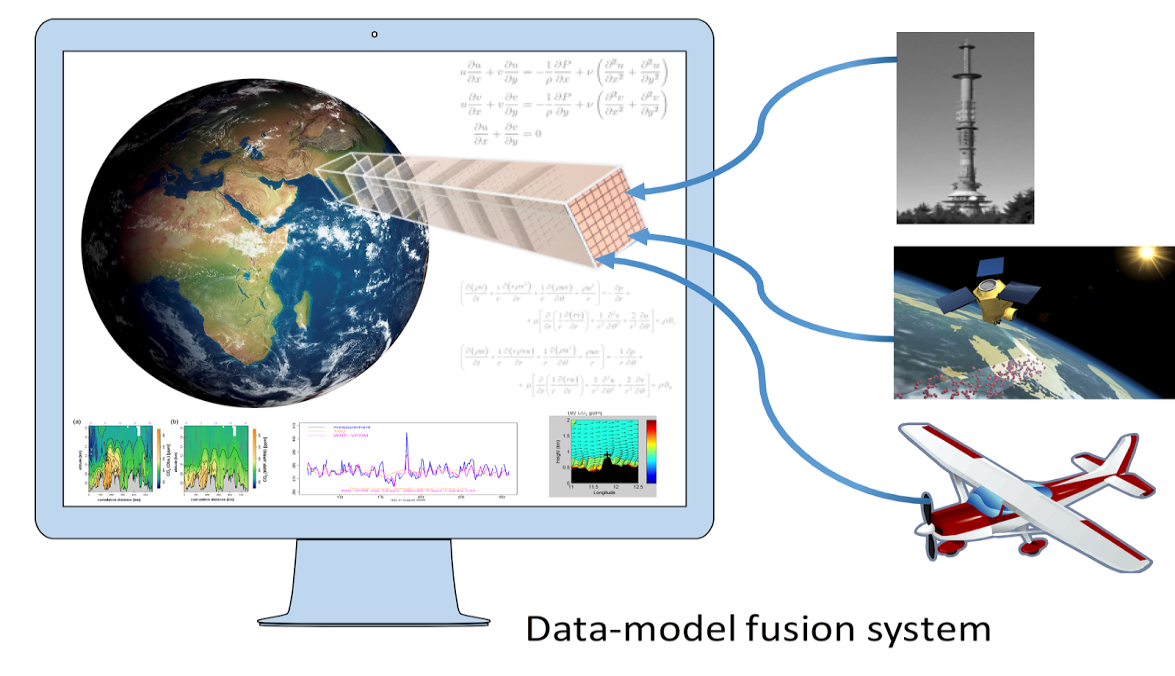
One of the important aspects of our research activities is to implement and further develop a high-resolution inversion framework to quantify GHG (mainly CO2, and CH4) sources and sinks that are consistent with atmospheric observations. Towards this, both Eulerian and Lagrangian modeling techniques are being developed and used as the core components of the modeling framework. Our current work @IISERB is focussed on the Indian subcontinent, a critically important but under-sampled region.Presently the group is working on generating high-resolution simulations of GHG over India, which will be used for a wide range of climate-related studies. These data products are further used for designing optimum measurement network over India. We are also working on validating the forward simulations with an objective to improve the atmospheric transport models and characterize their uncertainties. A wide range of data streams (including remote sensing data) and their analysis are involved in this process. The the group is also involved in developing significant strategies for incorporating these observations in an Bayesian inverse modeling framework, taking into account measurement and model errors.
Prof. Dr. Martin Heimann
(Max Planck Institute of Biogeochemistry, Jena, Germany)
Dr. habil.Christoph Gerbig
(Max Planck Institute of Biogeochemistry, Jena, Germany)
Dr. Julia Marshall
(German Aerospace Center, Institute for Atmospheric Physics, Oberpfaffenhofen, Germany)
Dr. Arlyn Andrews
(National Oceanic and Atmospheric Administration (NOAA), USA)
Dr. Pieter Tans
(National Oceanic and Atmospheric Administration (NOAA), USA)
Dr. Michael Buchwitz
(Physics and Chemistry of the Atmosphere (IUP), Uni Bremen, Germany)
Prof. Dr. John Burrows
(Physics and Chemistry of the Atmosphere (IUP), Uni Bremen, Germany)
Dr. Yogesh Tiwari
(Indian Institute of Tropical Meteorology (IITM), Pune, India)
Dr. Vinayak Sinha
(Indian Institute of Science Education and Research (IISER), Mohali)
Dr. C S Jha
(National Remote Sensing Centre ISRO, Hyderabad)
CarbonSat Team

SERB

MHRD